All guidesReports & oversight
Read the management reports
One screen of numbered figures across money, operations and people — and what each one is actually telling you.
- Steps
- 5 · About 3 min
- Who can do this
- Owner · Manager · Accountant · Read only
- Needs the module
- Reports & oversight
Reports puts the whole business on one screen: what came in, what went out, what is stuck, and what people are working on. Every figure is numbered, and every group has a link into the module the figures come from.
Read it in the order it is laid out — money first, because that is what runs out.
Three groups, in the order that matters
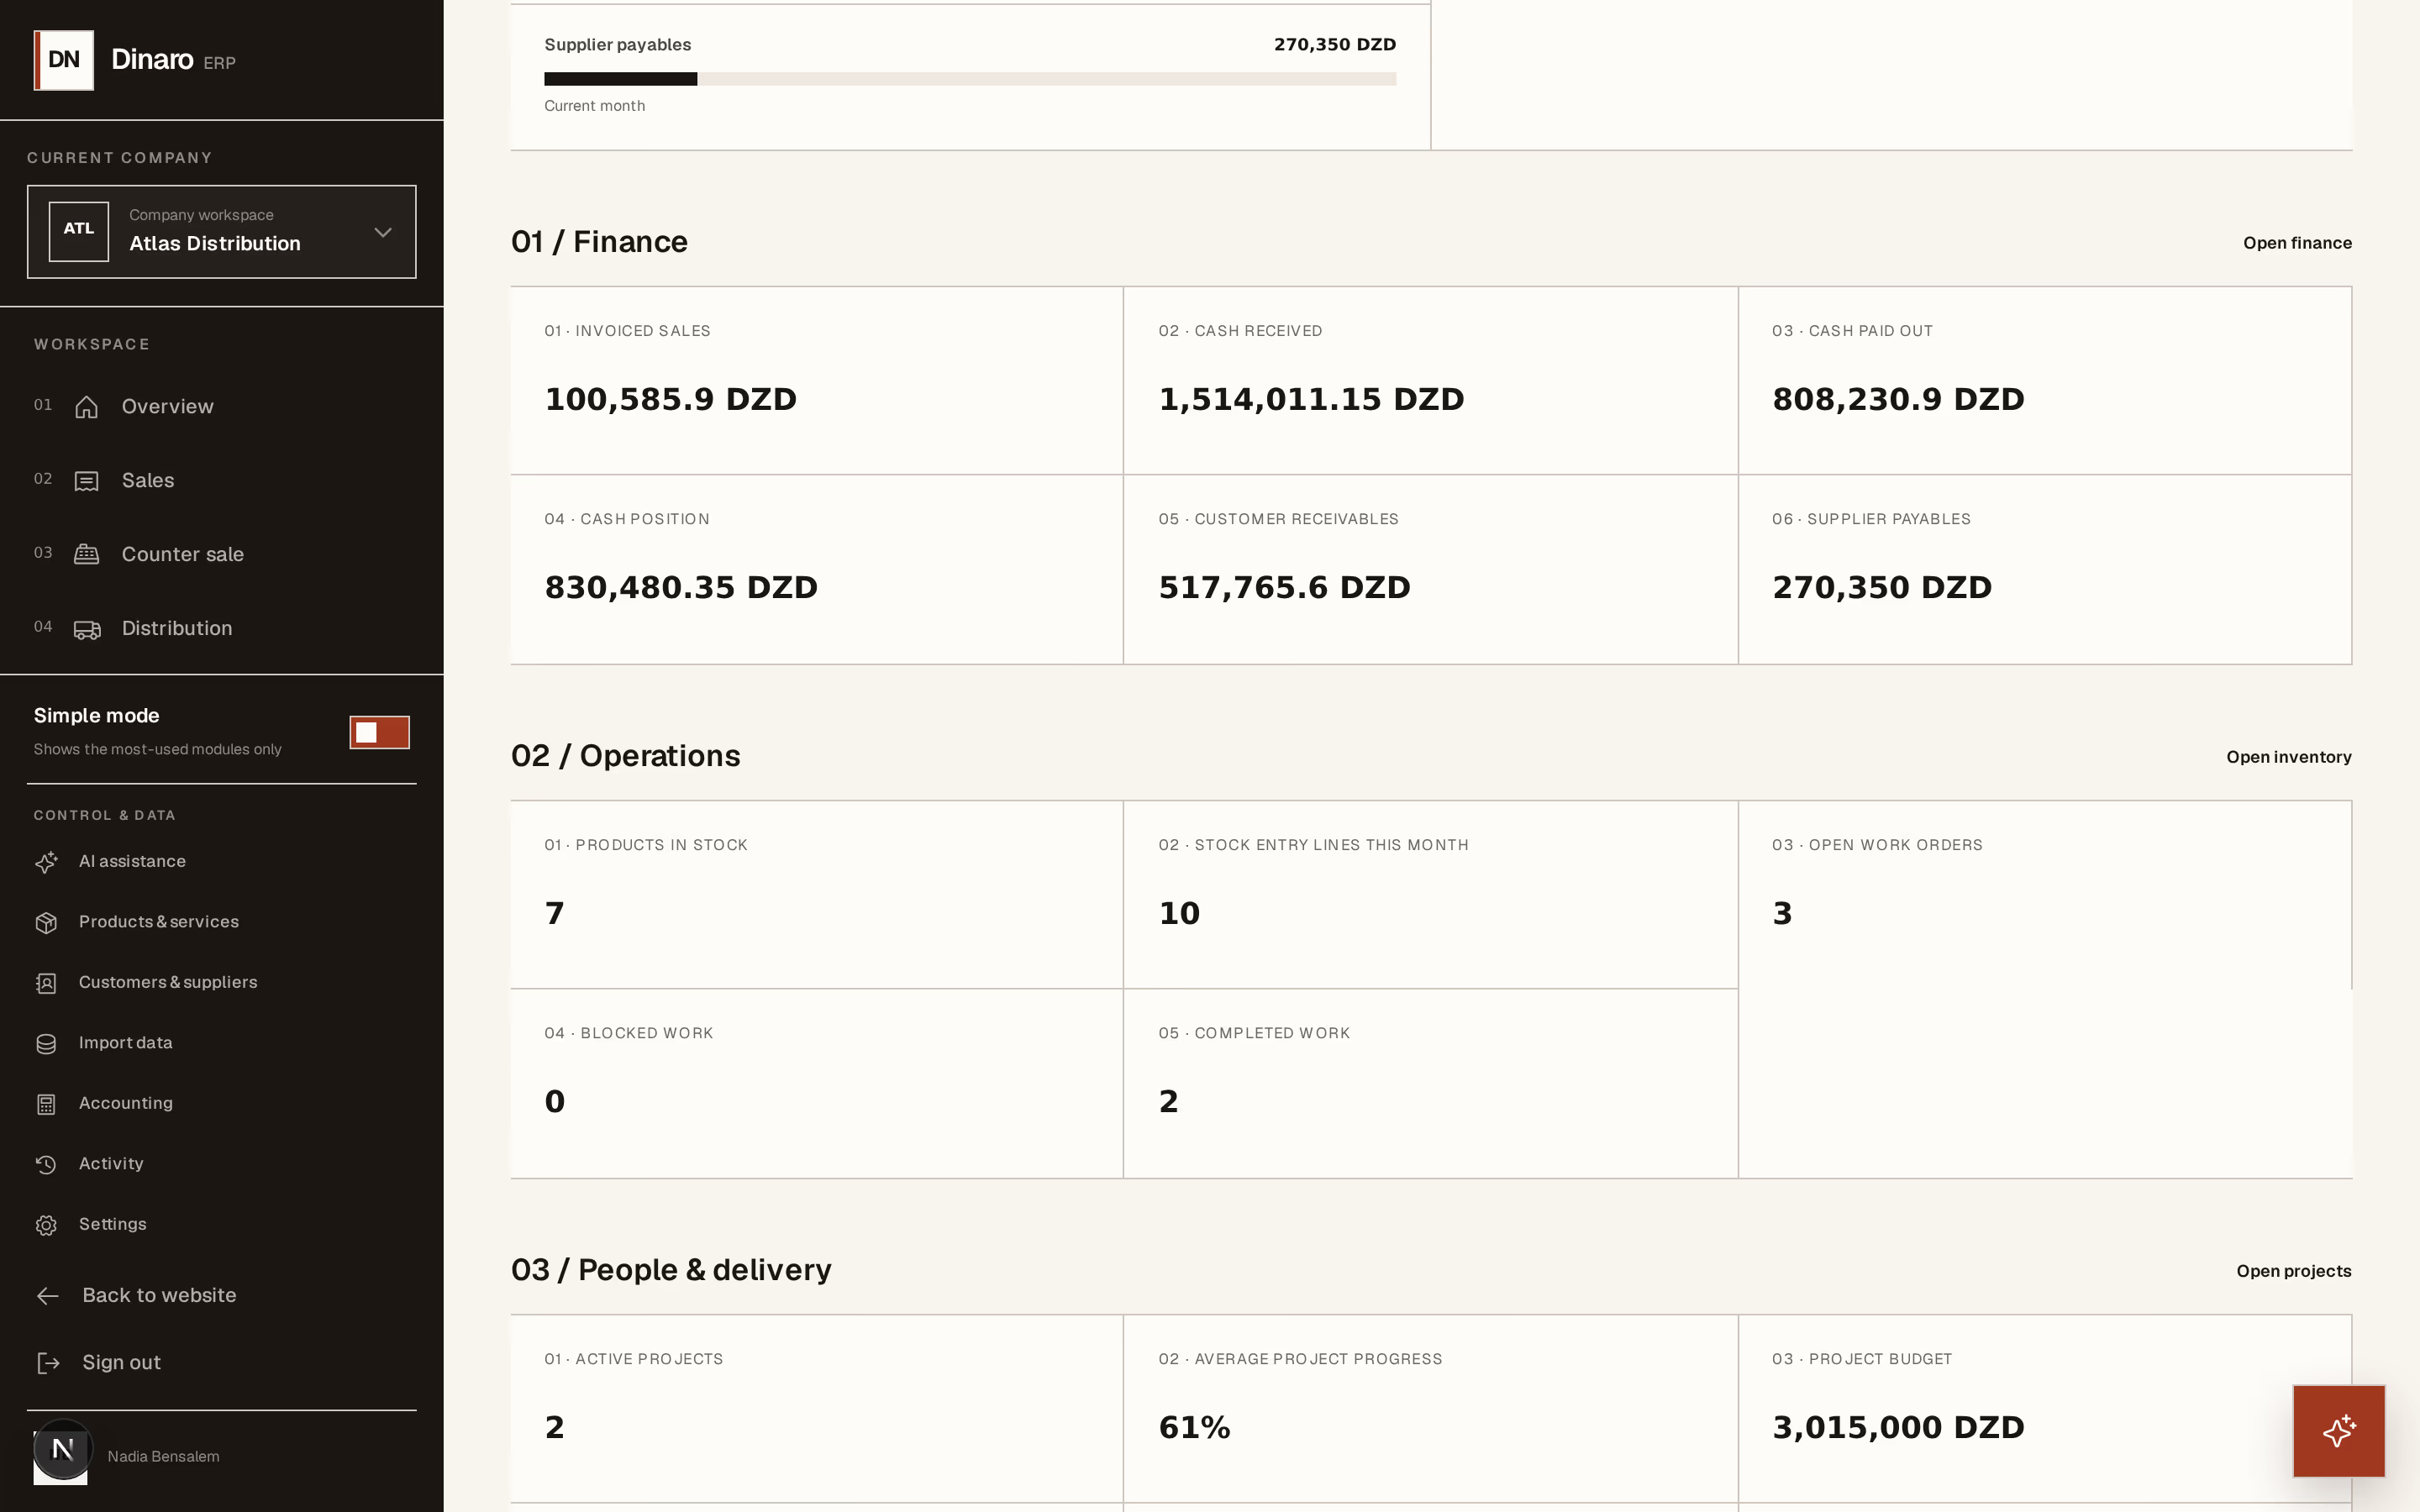
What to look at:
01 / Finance — money in, money out, and what is owed in both directions.
02 / Operations — stock, work orders, and what is blocked.
03 / People & delivery — projects, progress, budget, and the rounds.
Finance
Invoiced sales, cash received, cash paid out, cash position, customer receivables and supplier payables.
Read them as three pairs. Invoiced sales against cash received is the gap between selling and being paid. Cash in against cash out is whether the month funded itself. Receivables against payables is your position with everybody else — and if the first number is large, the next place to go is what you are owed, which breaks it down by how late it is.
Invoiced sales is not profit and cash position is not profit; the financial statements are where profit lives.
Operations
Products in stock, stock entries this month, open work orders, blocked work, and completed work.
Blocked work is the one to read first. It is the only figure here that represents somebody waiting for somebody else. A blocked count that does not move between two mornings is a job nobody has picked up, and it is invisible everywhere except this line.
People and delivery
Active projects, average project progress, project budget, and the delivery figures beneath.
Average progress is a genuine average across projects, so one project finishing and one starting can leave it unchanged while a great deal happened. Read the count next to it, not on its own.
Using it honestly
These are current figures, recalculated when you open the screen. They are for noticing, not for reporting — nothing here is a declaration, and none of it is signed.
When a number surprises you, do not argue with it: open the module behind it with the link at the group's head, and read the documents that made it. Every figure on this screen has a list behind it.
The figures respect the company you are in, and your role. Somebody with narrower access sees the same layout with fewer numbers, which is intended — this screen shows what you are allowed to see, not everything that exists.
Next, you might want to
- Follow what you are owedRead the ageing block — who is late, by how long, and which balances have no due date at all.
- Read the income statement, balance sheet and ledgerSee profit, financial position, and every movement behind them — each total traceable back to the entries that made it.
- Read the activity trailSee who did what, when, across the whole company — the record that settles "who changed this?"